Retiring on $800k: Maya’s Barista FIRE Stress-Test
Most discussions about early retirement present an all-or-nothing choice. Either you grind in a 60-hour corporate career until you accumulate $2.5 million, or you cut expenses down to the bone in LeanFIRE.
Barista FIRE offers a practical middle path. Instead of forcing your investment portfolio to fund 100% of your living expenses from day one, you transition into low-stress part-time work. You cover your baseline grocery and housing costs with active earnings, while your nest egg covers the rest with a modest withdrawal rate.
On paper, retiring on $800,000 with a $52,000 annual spending plan seems impossible under traditional retirement guidelines. Full retirement on that budget requires an initial withdrawal rate of 6.50% ($52,000 / $800,000). In historical market downturns, a 6.50% initial draw fails rapidly.
Under Barista FIRE, earning $28,000 a year from 20 hours a week changes the entire picture. Your portfolio only needs to provide $24,000 a year ($2,000 a month), which represents an initial draw rate of just 3.00%.
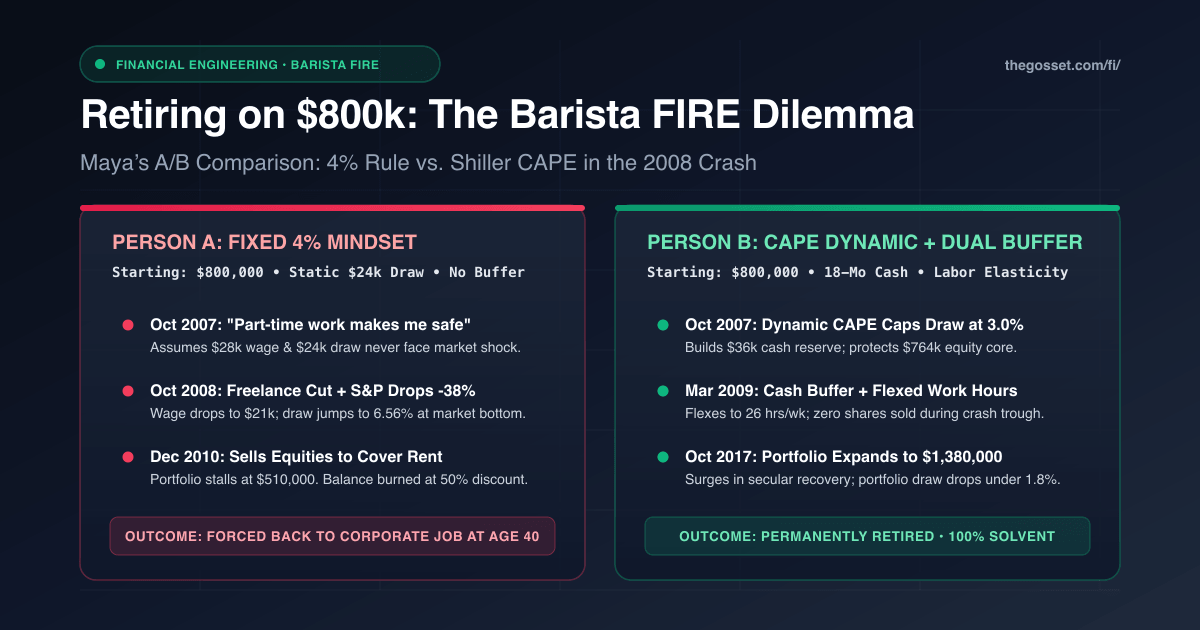
To see how this strategy holds up during a severe market downturn, let's examine two identical investors, both named Maya (age 35). Both accumulated $800,000 working in tech operations. Both left full-time corporate work in October 2007, right before the Great Financial Crisis, to work 20 hours a week in specialty bike mechanics and freelance operations.
One Maya was forced back into a full-time corporate job at age 40. The other emerged a decade later with over $1.38 million.
The difference came down to three specific choices. Person A trusted the rigid 4% rule and assumed part-time wages were guaranteed. Person B paired Shiller CAPE dynamic withdrawals with an 18-month cash buffer and flexible labor hours.
Maya's $52,000 Barista FIRE Budget
Maya enjoyed an active lifestyle centered around gravel cycling, weekend camping, and specialty espresso. She rented an apartment in Portland and kept her fixed costs predictable.
Her $52,000 annual budget ($4,333/month) balanced essential living costs with discretionary flexibility:
┌────────────────────────────────────────────────────────────────────────┐
│                   Maya's Barista FIRE Monthly Budget                   │
│                      $52,000 / Year ($4,333 / Mo)                      │
├────────────────────────────────────────────────────────────────────────┤
│ 1. ESSENTIAL LIVING EXPENSES: $36,000/yr ($3,000/mo)                   │
│    • Rent & local tenant insurance:       $1,600/mo                    │
│    • ACA Silver healthcare plan:            $450/mo                    │
│    • Whole-food groceries & household:      $450/mo                    │
│    • Utilities, heat, & high-speed web:     $250/mo                    │
│    • Bike transit & shared car-share:       $250/mo                    │
│                                                                        │
│ 2. DISCRETIONARY LIFESTYLE BUFFER: $16,000/yr ($1,333/mo)              │
│    • Weekend gravel cycling & trail trips:  $600/mo                    │
│    • Espresso beans, cafes, & dining out:   $350/mo                    │
│    • Outdoor gear maintenance:              $250/mo                    │
│    • Contingency miscellaneous buffer:      $133/mo                    │
│                                                                        │
│ 3. FUNDING ARCHITECTURE: $4,333 / Month                                │
│    • Part-Time Income (20 hrs/wk):        $2,333/mo ($28,000/yr)       │
│    • Portfolio Withdrawal (3.0% draw):    $2,000/mo ($24,000/yr)       │
└────────────────────────────────────────────────────────────────────────┘
Notice the structural cushion in this setup:
- Her part-time income of $28,000 covers 78% of her essential baseline expenses ($36,000).
- Her required portfolio withdrawal is only $24,000, which equals a conservative 3.00% draw on her starting $800,000 nest egg.
- Her budget contains $16,000 a year in discretionary lifestyle spending that can be trimmed during lean times.
Her starting portfolio was invested in a classic balanced allocation: 75% total stock market index funds and 25% intermediate fixed income. In October 2007, her savings totaled exactly $800,000.
Two Strategies on the Eve of 2007
Before leaving her corporate employer, each Maya established her withdrawal rules.
Person A: The Fixed 4% Mindset
Person A relied on standard rules of thumb:
"A 4% withdrawal rate has survived every 30-year period in American market history," Maya A thought. "Because I only need to withdraw $24,000 from $800,000, my initial rate is 3.00%. That gives me a huge margin of safety. When inflation hits, I will simply increase my dollar withdrawal to match CPI."
Maya A scheduled an automatic monthly transfer of $2,000 from her brokerage account. She assumed her 20 hours a week of freelance work would remain stable, and kept zero dedicated cash reserves.
Person B: Valuation Awareness and the Dual Safety Valve
Person B evaluated the market environment using our foundational guide on Dynamic Safe Withdrawal Rates & Shiller CAPE.
She noticed a clear vulnerability: in October 2007, the Shiller CAPE ratio stood at 27.3, well above historical averages. High starting market valuations pointed toward muted real equity returns over the coming decade.
She calculated her dynamic withdrawal rate:
SWR_t = α + β · (1 / CAPE_t)
With baseline parameters α = 1.75% and β = 0.50:
SWR_2007 = 1.75% + 0.50 · (1 / 27.3) = 1.75% + 1.83% = 3.58%
At a 3.58% ceiling, her maximum safe portfolio withdrawal was $28,640. Her planned $24,000 draw sat comfortably below that ceiling.
However, Maya B recognized an often overlooked reality in Barista FIRE planning: during economic recessions, freelance rates and part-time hours can shrink at the exact same moment equity prices drop.
To guard against that risk, she set up two distinct safety valves:
- An 18-Month Cash Buffer: She carved out $36,000 (18 months of her $2,000 portfolio withdrawal) from her fixed income allocation into high-yield cash and short-term Treasury bills.
- Labor Elasticity (The Human Capital Put): She agreed with her local bicycle cooperative that she could flex her schedule up to 26 hours a week if economic conditions tightened.
What Happened During the 2007-2009 Crisis
What arrived was the Great Financial Crisis.
Between October 2007 and March 2009, the S&P 500 plunged 56% peak-to-trough. Credit markets froze, consumer spending contracted, and businesses cut contract labor.
┌────────────────────────────────────────────────────────────────────────┐
│              GFC Stress-Test: Maya's Portfolio (2007-2009)             │
│                                                                        │
│  Oct 2007: Both Start at $800,000                                      │
│  ───────────────────────────────────                                   │
│  Oct 2008 (S&P -38%, Freelance Rates Squeezed):                        │
│    • Person A (Static draw + income drop):   Portfolio = $610,000      │
│    • Person B (Cash buffer absorbs draw):    Equity Core = $645,000    │
│                                                                        │
│  Mar 2009 (Market Trough, S&P -56% Peak-to-Trough):                    │
│    • Person A (Selling at bottom, draw 6.5%):Portfolio = $495,000      │
│    • Person B (Flexed hours + cash buffer):  Equity Core = $575,000    │
│                                                                        │
│  Dec 2010 (The Breaking Point):                                        │
│    • Person A: Portfolio Stalls at $510,000 (Withdrawal Rate = 6.4%)   │
│    • Person B: Equities Untouched ($720,000), Cash Reserve Rebuilt     │
└────────────────────────────────────────────────────────────────────────┘
The Breakdown for Person A
For Maya A, the crisis hit both sides of her financial equation simultaneously.
In late 2008, two of her primary freelance consulting clients terminated their contracts. Her part-time earnings dropped from $28,000 to $21,000 a year.
At the same time, inflation in 2008 (+3.8%) raised her baseline cost of living from $52,000 to $53,500.
Because her earned income had dropped to $21,000, her portfolio was suddenly required to supply $32,500 a year ($2,708 a month) instead of the planned $24,000.
Meanwhile, her $800,000 portfolio collapsed to $495,000 by March 2009.
Pulling $32,500 from a $495,000 portfolio drove her effective withdrawal rate to 6.56% at the bottom of the market. Without a cash reserve, she had to sell distressed stock index shares every single month to pay rent.
By late 2010, the broader market started to recover, but Maya A's balance hovered at just $510,000. She had sold too many shares at depressed prices during 2008 and 2009 to catch the rebound.
Facing sustained financial stress, Maya A gave up on Barista FIRE in 2011 at age 40 and accepted a full-time corporate management job to rebuild her savings.
How Person B Managed the Downturn
Maya B experienced the same economic contraction, but her dual safety valves changed the outcome completely.
When market valuations collapsed in 2008, Maya B executed her safety valves immediately:
First, all portfolio draws for 18 months came directly from her $36,000 cash reserve. She did not sell a single share of stock during the crash.
Second, she paused long-distance travel and reduced cafe spending, lowering her discretionary spending from $16,000 to $11,200 ($400/month reduction).
Third, rather than letting contract reductions shrink her income, she added 6 hours a week at the local bike co-op, performing tune-ups for commuters switching away from cars. Her active earnings increased to $31,000.
With $31,000 in active earnings and a reduced living budget of $47,200, her required portfolio draw fell to just $16,200 a year ($1,350 a month).
Because that entire $16,200 was funded from her cash buffer, her equity portfolio remained fully invested. At the market bottom in March 2009, her equity core held at $575,000, ready to participate in the upcoming recovery.
The 10-Year Divergence (2007 to 2017)
Over the following decade, the two paths produced radically different financial outcomes.
┌────────────────────────────────────────────────────────────────────────┐
│             The 10-Year Divergence: 2007 through 2017                  │
│                                                                        │
│ $1.4M  ┬                                            Person B: $1.38M   │
│        │                                           ┌─────────────────  │
│ $1.0M  ┼───────────┐                              ┌┘                   │
│        │            \            /\              /                     │
│  $800k ┼             \__________/  \____________/                      │
│        │                                                               │
│  $500k ┼                                        Person A: $440k        │
│        │                                        (Forced Work at 40)    │
│    $0  ┴───────────────────────────────────────────────────────────────│
│       2007   2008   2009   2011   2013   2014   2015   2017            │
└────────────────────────────────────────────────────────────────────────┘
Person A: Career Re-Entry and Lost Freedom
Because Maya A liquidated equities during 2008-2009, her portfolio lacked the compounding power to recover.
By 2011, her portfolio stood at $440,000 in real terms. With client budgets sluggish and her living expenses rising, maintaining early retirement was no longer viable.
She spent the next six years back in 50-hour workweeks, rebuilding her emergency fund and retirement accounts while giving up the schedule autonomy she had worked so hard to achieve.
Person B: Compounding into Permanent Independence
Because Maya B preserved every share of stock through the downturn, her investments captured the full momentum of the post-2009 bull market:
- By 2012, her balance expanded to $930,000, fully surpassing her pre-crisis peak.
- By 2015, her nest egg reached $1,150,000.
- By October 2017, ten years after leaving her corporate job, her portfolio stood at $1,380,000.
At $1.38 million, withdrawing her original $24,000 living supplement represented an effective withdrawal rate of just 1.74%.
Maya B could choose to stop working entirely, or continue working 15 to 20 hours a week purely for enjoyment and community involvement.
The 10-Year Scorecard
Ten years after starting Barista FIRE, here is how the two approaches performed:
| Metric (After 10 Years) | Person A (Fixed 4% Mindset) | Person B (Dynamic CAPE + Dual Buffer) |
|---|---|---|
| Starting Nest Egg (2007) | $800,000 | $800,000 |
| Ending Nest Egg (2017) | $440,000 (-45% capital destruction) | $1,380,000 (+72% net capital growth) |
| Work Status at Age 45 | Forced full-time corporate employee | Complete financial autonomy |
| Peak Withdrawal Rate | 6.56% (severe stress zone) | 2.82% (well within safe bounds) |
| Equities Sold During Crash | Liquidated monthly at 50% discount | Zero shares sold during the bottom |
| Hours Worked During Trough | Passive decline to 15 hrs/wk | Deliberate flex to 26 hrs/wk (9 months) |
The Barista FIRE Playbook: How to Protect an $800k Nest Egg
If you want to transition into Barista FIRE on $600,000 to $1,000,000, relying on a static withdrawal rule is risky. You need active structural safeguards:
1. Build an 18-to-24-Month Cash Buffer
Do not enter semi-retirement without dedicated liquidity. Hold 18 to 24 months of your net portfolio draw in cash, money market funds, or short-term Treasury bills. If the market drops 40%, you can draw living expenses from cash for up to two years without selling a single equity share.
2. Recognize Labor Elasticity
Your ability to earn active income is an asset. When equity markets crash, increasing your work by just 4 to 6 hours a week can produce an extra $400 to $800 a month. That modest income boost protects your portfolio from destructive Sequence of Returns Risk during the critical early years.
3. Check Shiller CAPE Before Setting Your Spending
At the beginning of each year, verify your safe withdrawal ceiling against current valuations:
SWR = 1.75% + 0.50 × (1 / CAPE)
4. Backtest Your Household Plan
Every investor has unique expenses, housing costs, and healthcare situations. You can backtest your specific budget across all 154 historical market cohorts using our free client-side tool:
👉 Simulate Your Portfolio in TheGosset FI Portal
If you have not created your private dashboard yet, follow our step-by-step setup guide:
👉 Setting Up TheGosset FI Portal: Step-by-Step Guide
The Complete Shiller CAPE Avatar Cluster
Explore the complete collection of real-world A/B case studies across every wealth tier:
- 📚 Foundational Guide: Dynamic Safe Withdrawal Rates: Why Shiller CAPE Beats the 4% Rule
- 🛠️ Coast FIRE ($350k): Retiring on $350k: Liam’s Coast FIRE Stress-Test in the Lost Decade
- 🚲 LeanFIRE ($600k): Retiring on $600k: Elena’s LeanFIRE Stress-Test in 1970s Stagflation
- ☕ Barista FIRE ($800k): Retiring on $800k: Maya’s Barista FIRE Stress-Test in the 2008 Crash
- 👨👩👧👦 Core FIRE ($1.25M): Retiring on $1.25M: Marcus & Priya's 4% Rule vs. Shiller CAPE A/B Test
- 🎿 ChubbyFIRE ($2.5M): Retiring on $2.5M: David’s ChubbyFIRE Stress-Test in the 2008 Crash
- 🏰 FatFIRE ($5.0M): Retiring on $5M: The Sterlings’ FatFIRE Blueprint in the 2022 Crash