Retiring on $1.25M: The 4% Rule vs. Shiller CAPE A/B Test
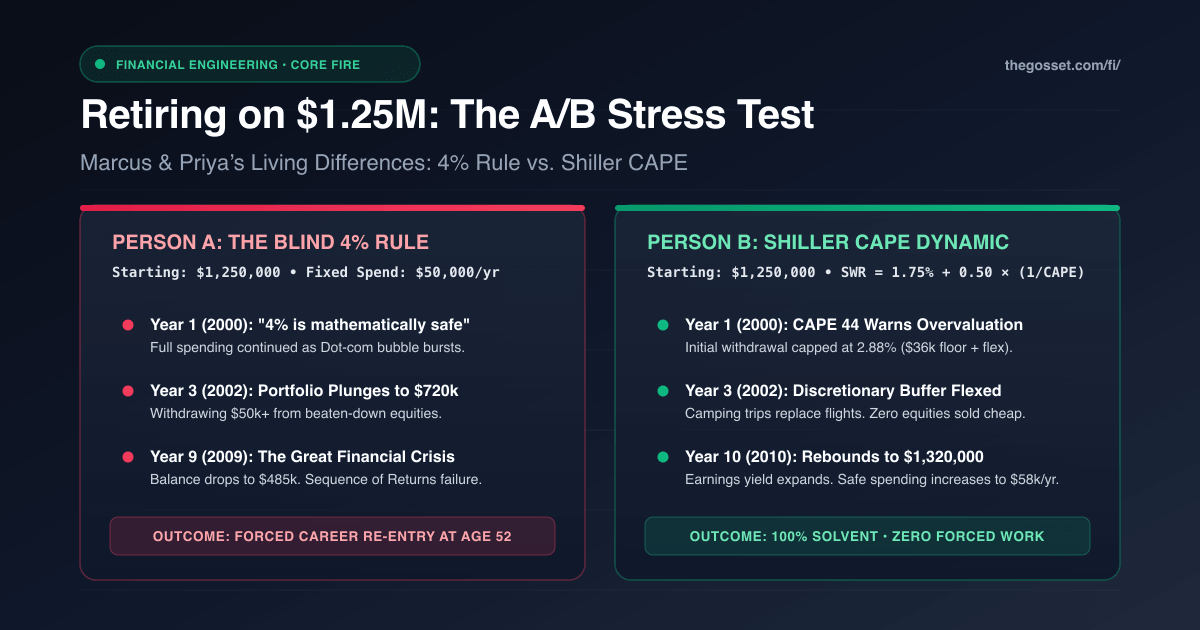
Imagine two couples who start retirement with the exact same financials.
Both husbands are named Marcus (age 43), both wives are named Priya (age 41), and both have two kids (ages 8 and 11). Both families own a paid-off home in the suburbs and have saved an identical $1,250,000 in index funds (75% equities / 25% bonds).
Both target the exact same annual spend: $50,000 a year ($4,166 per month).
On January 3, 2000, both couples retire.
Ten years later, one couple has to go back to work with a damaged portfolio, while the other couple remains comfortably retired with over $900,000 in capital and an expanding vacation budget.
They held the same index funds. Neither tried to day-trade or time the market.
Their paths diverged because of one initial rule. Person A followed the standard 4% Rule, while Person B used the Shiller CAPE Dynamic Withdrawal framework.
Here is the breakdown of how that single rule changed their financial reality across a full ten-year market cycle.
The $1.25M Starting Line and Budget Breakdown
A $50,000 annual spend on a $1,250,000 portfolio represents an initial withdrawal rate of exactly 4.00% ($1,250,000 × 0.04 = $50,000).
Marcus and Priya divided their budget into two clear tiers:
┌────────────────────────────────────────────────────────┐
│           Marcus & Priya's Household Budget            │
│                 $50,000 / Year ($4,166 / Mo)           │
├────────────────────────────────────────────────────────┤
│ 1. NON-DISCRETIONARY BASELINE: $36,000/yr ($3,000/mo)  │
│    • Property taxes & home insurance:     $750/mo      │
│    • ACA family health insurance:         $850/mo      │
│    • Groceries & household staples:       $700/mo      │
│    • Utilities, internet, & phone:        $350/mo      │
│    • Auto insurance, fuel, maintenance:   $350/mo      │
│                                                        │
│ 2. DISCRETIONARY LIFESTYLE BUFFER: $14,000/yr ($1,166) │
│    • Annual family summer road trips:     $5,000/yr    │
│    • Weekend dining out & social events:  $4,000/yr    │
│    • Kids' sports leagues & camp:         $3,000/yr    │
│    • Hobbies, streaming, & miscellaneous: $2,000/yr    │
│                                                        │
│ TOTAL: $4,166 / Month ($50,000 / Year)                 │
└────────────────────────────────────────────────────────┘
In January 2000, market sentiment was euphoric. The tech sector was hitting record highs almost daily.
What the headlines missed was that the Shiller CAPE ratio stood at 44.2, the highest valuation multiple in 154 years of US stock market history.
Two Different Retirement Strategies in January 2000
Here is where the two couples took different approaches.
Person A: The Fixed 4% Rule
Couple A followed standard Trinity Study rules:
"The 4% rule worked across the Great Depression and the 1970s," Marcus A noted. "We pull $50,000 in Year 1, increase that dollar draw for inflation every January, and the portfolio lasts 30 years."
They set up an automated transfer of $4,166 a month from their brokerage to checking, intending to ignore stock market news entirely.
Person B: Dynamic Shiller CAPE Guardrails
Couple B understood the mechanism explained in our guide on Dynamic Safe Withdrawal Rates & Valuation Risk. They knew that the 4% rule is valuation-blind: 4% is very safe when stocks trade at 12x earnings, but high-risk when stocks trade at 44x earnings.
They calculated their initial draw using the dynamic CAPE formula:
SWR_t = α + β · (1 / CAPE_t)
With standard parameters α = 1.75% and β = 0.50:
SWR_2000 = 1.75% + 0.50 · (1 / 44.2) = 1.75% + 1.13% = 2.88%
The formula gave Couple B a clear guideline: At a CAPE of 44.2, the sustainable baseline withdrawal rate was 2.88%, not 4.00%.
On a $1,250,000 portfolio, 2.88% equaled $36,000 per year ($3,000 per month).
Couple B looked at their budget. $36,000 covered 100% of their non-discretionary baseline expenses (property taxes, health insurance, groceries, utilities).
"We can still retire today," Priya B decided. "But until market valuations come down, we treat our $14,000 discretionary budget as flexible. We skip expensive resort flights and camp locally to avoid liquidating equities during an obvious valuation bubble."
The 2000-2003 Dot-Com Drop
In March 2000, the Dot-Com bubble burst. Over the next two and a half years, the S&P 500 fell 49%.
┌────────────────────────────────────────────────────────────────────────┐
│            Portfolio Balances During the Dot-Com Crash (2000-2003)     │
│                                                                        │
│  Jan 2000: Both Start at $1,250,000                                    │
│  ───────────────────────────────────                                   │
│  Dec 2000:                                                             │
│    • Person A (Spent $51,700 w/ CPI):   Portfolio = $1,080,000         │
│    • Person B (Spent $36,000 Baseline): Portfolio = $1,110,000         │
│                                                                        │
│  Dec 2001:                                                             │
│    • Person A (Spent $53,150 w/ CPI):   Portfolio = $895,000           │
│    • Person B (Spent $36,800 Baseline): Portfolio = $945,000           │
│                                                                        │
│  Oct 2002 (Trough):                                                    │
│    • Person A: Portfolio Plunges to $715,000                           │
│    • Person B: Portfolio Holds at $840,000                             │
└────────────────────────────────────────────────────────────────────────┘
What Happened to Person A
Because Couple A committed to a constant inflation-adjusted dollar amount, by late 2002 they were withdrawing $54,000 per year from a portfolio that had shrunk to $715,000.
Their effective withdrawal rate jumped from 4.0% to 7.55%.
Every month, they were selling index fund shares at depressed prices to fund their checking account. Because the Bengen rule offered no built-in rules for trimming spending, they had no clear framework for when to cut back or when it was safe to resume normal spending.
How Person B Handled the Downturn
Couple B felt the downturn, but their process was straightforward:
- They paused their $5,000 annual resort vacation and camped in state parks with their kids.
- They trimmed restaurant meals and hosted family dinners at home.
- Their annual withdrawal stayed capped at $36,000 to $38,000, protecting their core share count.
Because they weren't selling shares at rock-bottom valuations, their portfolio troughed at $840,000, which was $125,000 higher than Couple A.
The 2008 Double-Dip and the 10-Year Divergence
Markets recovered between 2003 and 2007. But before portfolios could fully rebuild, the 2008 Financial Crisis arrived, sending the S&P 500 down another 57%.
This double-crash sequence is what financial analysts refer to as a "Lost Decade", the exact scenario where static withdrawal strategies run into trouble.
┌────────────────────────────────────────────────────────────────────────┐
│             The 10-Year Divergence: 2000 through 2010                  │
│                                                                        │
│  $1.5M ┬                                            Person B: $1.32M   │
│        │                                           ┌─────────────────  │
│  $1.0M ┼───────────┐                              ┌┘                   │
│        │            \            /\              /                     │
│  $500k ┼             \__________/  \            /                      │
│        │                            \__________/                       │
│        │                                        Person A: $485k        │
│    $0  ┴────────────────────────────────────────(Career Re-Entry)──────│
│       2000   2001   2003   2005   2007   2008   2009   2010            │
└────────────────────────────────────────────────────────────────────────┘
Person A: Forced Career Re-Entry (March 2009)
By early 2009, Person A’s portfolio had dropped to $485,000.
Adjusting for nine years of inflation, the 4% rule now called for an annual draw of $63,500. Pulling $63,500 from a $485,000 balance meant an effective withdrawal rate of 13.1%.
At that burn rate, their remaining capital would have run out in less than five years.
At age 52, after nine years away from work, Marcus A re-entered the workforce. In a soft economy, he took a corporate role to rebuild their reserves, while Priya took an administrative job for health insurance benefits. Their early retirement was over.
Person B: Expanding Spending as Valuations Bottomed
In March 2009, as stock prices hit bottom, the Shiller CAPE ratio dropped to 13.3. The Cyclically Adjusted Earnings Yield climbed to 7.52% ($1 / 13.3$).
Couple B ran their annual calculation:
SWR_2009 = 1.75% + 0.50 · (1 / 13.3) = 1.75% + 3.76% = 5.51%
Because equities were trading at bargain valuations, expected forward returns over the following decade were high (historically exceeding 10% real). The formula gave them clear permission to safely increase spending.
With their portfolio preserved at $890,000, a 5.51% withdrawal rate authorized an annual spend of $49,000.
As the 2010 to 2020 bull market developed:
- By 2012, Couple B's portfolio reached $1,150,000.
- By 2016, their balance grew to $1,480,000.
- By 2020, their portfolio stood at $1,920,000, while funding their kids' college expenses and traveling regularly.
The 10-Year Scorecard: What Happened to Both Portfolios
Ten years after their retirement date, here is where both families stood:
| Metric (After 10 Years) | Person A (Fixed 4% Rule) | Person B (Dynamic Shiller CAPE) |
|---|---|---|
| Starting Balance (Jan 2000) | $1,250,000 | $1,250,000 |
| Ending Balance (Dec 2009) | $485,000 (-61% loss) | $980,000 (Preserved capital) |
| 2024 Balance (Today) | ~$350,000 (depleted) | >$2,100,000 (surplus wealth) |
| Current Work Status | Forced back to work at 52 | Permanently retired (24+ years) |
| Max Withdrawal Rate Reached | 13.1% (catastrophic) | 5.51% (healthy valuation peak) |
| Household Stress | Chronic anxiety over capital loss | Clear, rule-guided flexibility |
The Core FIRE Playbook for Portfolios Between $1.0M to $1.5M
If you are planning to retire with $1,000,000 to $1,500,000, you can protect your plan with three simple rules:
1. Split Expenses into Fixed and Discretionary Buckets
Review your last 12 months of spending:
- Fixed baseline expenses, which covers the minimum required for housing, healthcare, groceries, and utilities. This should be covered by
1.75% × Portfolioplus any reliable income. - Discretionary cushion like travel, dining out, hobbies, and upgrades. This bucket flexes with
0.50 × (1/CAPE).
2. Check the CAPE Multiple Once a Year
You do not need to check stock prices daily. On the first weekend of January:
- Check the current Shiller CAPE ratio.
- Calculate your annual safe withdrawal percentage:
SWR = 1.75% + 0.50 × (1 / CAPE)
3. Backtest Your Household Plan
Every family has different spending profiles, asset allocations, and pensions. You can run your portfolio against 154 years of historical data using our free, private retirement tool:
👉 Open TheGosset FI Portal Retirement Simulator
If you haven’t connected your private Google Sheet yet, start with our setup guide:
👉 Setting Up TheGosset FI Portal: Step-by-Step Guide
Continue Exploring the Shiller CAPE Case Studies
- 📚 Foundational Guide: Dynamic Safe Withdrawal Rates: Why Shiller CAPE Beats the 4% Rule
- 🚲 LeanFIRE Case Study: Retiring on $600k: Elena’s LeanFIRE Stress-Test in 1970s Stagflation
- 🎿 ChubbyFIRE Case Study: Retiring on $2.5M: David’s ChubbyFIRE Stress-Test in the 2008 Crash
- 🏰 FatFIRE Case Study: Retiring on $5M: The Sterlings’ FatFIRE Blueprint in the 2022 Crash