Retiring on $5M: The FatFIRE Blueprint
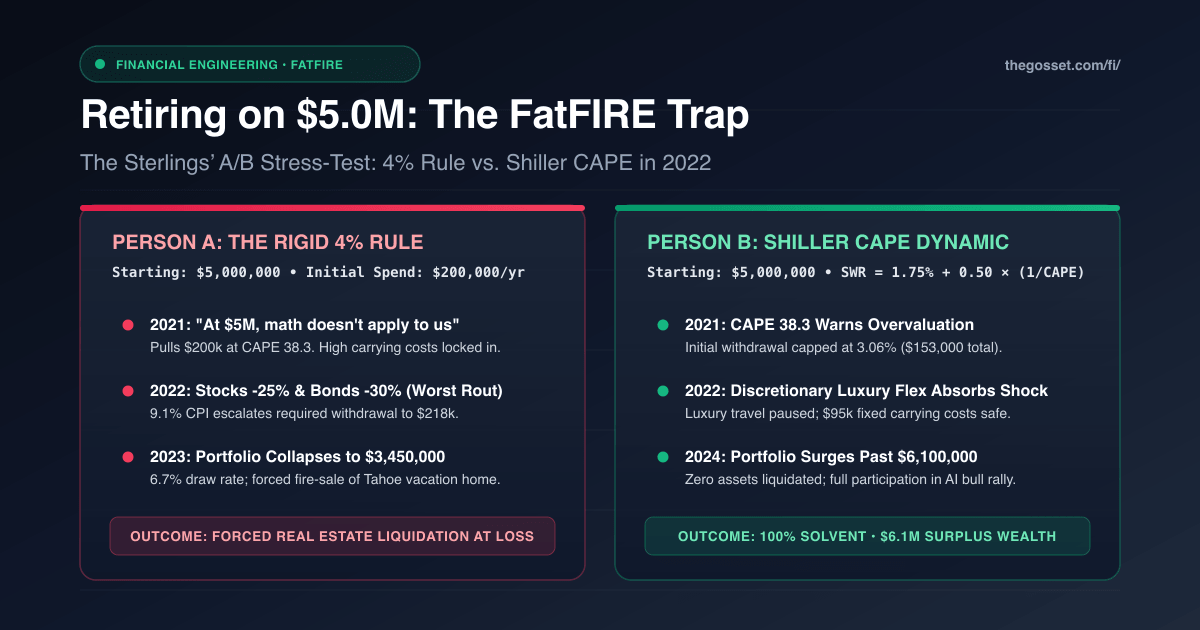
When people see a $5,000,000 net worth, they assume financial problems are completely solved. At a standard 4% withdrawal rate, a $5M portfolio generates $200,000 a year ($16,666 a month) in passive cash flow.
In the FIRE community, this tier is known as FatFIRE, early retirement with a generous lifestyle, secondary vacation homes, and zero compromise on travel or comfort.
Yet the math is clear: high net worth does not make you immune to Sequence of Returns Risk.
In fact, multi-million dollar portfolios face a specific vulnerability that lean retirees avoid: the high carrying-cost trap.
When you own a large primary residence and a luxury vacation property, your property taxes, insurance premiums, HOA fees, and maintenance don't drop when the stock market falls. You cannot put a $30,000 property tax bill on pause.
Here is the story of two identical couples, both named Richard and Victoria Sterling (ages 52 and 49). Both retired in November 2021 after selling their enterprise software company, starting with an identical $5,000,000 in index funds and an identical $200,000 annual spending target.
When hit by the 2022 market downturn, where stocks dropped, bonds cratered, and inflation spiked simultaneously, one couple ended up selling their Lake Tahoe vacation home at a steep discount to stop cash drain.
The other couple used the Shiller CAPE dynamic formula, kept both properties, and saw their liquid portfolio grow past $6.1 million.
The $5.0M Starting Line and Budget Breakdown
Richard and Victoria spent twenty years building their company in Bellevue, Washington. After their acquisition, they invested their proceeds into standard index funds: 85% global equities / 15% intermediate government bonds.
Their $200,000 annual budget ($16,666/month) broke down into two clear categories:
┌────────────────────────────────────────────────────────┐
│          The Sterlings' FatFIRE Annual Budget          │
│             $200,000 / Year ($16,666 / Mo)             │
├────────────────────────────────────────────────────────┤
│ 1. FIXED CARRYING COSTS (OVERHEAD): $95,000 / Year     │
│    • Bellevue primary residence taxes & HOA: $2,700/mo │
│    • Lake Tahoe vacation home taxes:         $2,350/mo │
│    • Private executive family healthcare:    $1,400/mo │
│    • Umbrella policies, auto, liability:       $650/mo │
│    • Annual accounting, legal, & tax prep:     $816/mo │
│                                                        │
│ 2. LUXURY LIFESTYLE FLEX: $105,000 / Year              │
│    • European summer travel & ski chalets:  $45,000/yr │
│    • Private golf & athletic club dues:     $20,000/yr │
│    • Fine dining, wine collecting, galas:   $22,000/yr │
│    • Angel investing checks & philanthropy: $18,000/yr │
│                                                        │
│ TOTAL: $16,666 / Month ($200,000 / Year)               │
└────────────────────────────────────────────────────────┘
Notice the underlying risk: $95,000 of their annual spend was fixed overhead.
Unlike Elena in our LeanFIRE case study, who had minimal fixed expenses, the Sterlings had nearly $8,000 a month in mandatory property taxes, insurance, and maintenance.
On November 1, 2021, their portfolio was exactly $5,000,000.
Two Strategies on the Eve of November 2021
In November 2021, stock markets were at all-time highs. The S&P 500 crossed 4,700, and valuations were stretched.
Specifically, the Shiller CAPE ratio stood at 38.3, the second-highest valuation level in 154 years of US market history, trailing only the 1999 Dot-Com peak.
Person A: Assuming Valuations Don't Matter
Couple A assumed that with $5 million in the bank, market cycles didn't require any adjustments:
"We have five million dollars in index funds," Richard A noted. "The 4% rule says we can pull $200,000 in Year 1, increase for inflation, and never run out of money. Why worry about market multiples?"
Couple A set up automatic monthly transfers of $16,666 from their brokerage accounts and booked private charters for ski season.
Person B: Valuation Awareness
Couple B reviewed the principles in our guide on Dynamic Safe Withdrawal Rates & Valuation Risk. They understood that with CAPE at 38.3, equity earnings yields had dropped to 2.61% ($1 / 38.3$).
They calculated their safe initial draw using the dynamic CAPE formula:
SWR_t = α + β · (1 / CAPE_t)
With baseline parameters α = 1.75% and β = 0.50:
SWR_2021 = 1.75% + 0.50 · (1 / 38.3) = 1.75% + 1.31% = 3.06%
The formula gave them a clear recommendation: When market valuations are near historical highs, the safe initial withdrawal rate is 3.06%, not 4.00%.
On a $5,000,000 portfolio, 3.06% equaled $153,000 per year ($12,750/month).
Couple B checked their budget. $153,000 covered 100% of their $95,000 fixed carrying costs, leaving $58,000 in luxury discretionary spending.
"We don't need to spend $200,000 right out of the gate," Victoria B decided. "We'll fly commercial business class instead of charters, hold off on angel investments, and spend the winter at our Tahoe house. We protect our core capital while valuations are extended."
The 2022 Stock, Bond, and Inflation Stress-Test
In 2022, the Federal Reserve raised interest rates rapidly to fight inflation.
What followed was a rare simultaneous decline in both equities and fixed income:
- S&P 500 declined -25.4%.
- Intermediate government bonds dropped -25% to -35%, marking one of the worst bond drops on record.
- Inflation (CPI) peaked at 9.1%.
- Property insurance and maintenance in resort markets like Lake Tahoe jumped 20% to 25%.
┌────────────────────────────────────────────────────────────────────────┐
│                  The 2022 Bear Market: The Sterlings                   │
│                                                                        │
│  Nov 2021: Both Start at $5,000,000                                    │
│  ───────────────────────────────────                                   │
│  Dec 2022 (CPI +9.1%, Stocks & Bonds Down):                            │
│    • Person A (Withdrew $218,200 w/ CPI): Portfolio = $3,620,000       │
│    • Person B (Flexed Spend to $142,000): Portfolio = $3,980,000       │
│                                                                        │
│  Oct 2023 (The Trough):                                                │
│    • Person A: Portfolio drops to $3,450,000 (Withdrawal Rate = 6.7%)  │
│      -> Sells Lake Tahoe retreat to stop cash burn                     │
│    • Person B: Portfolio holds at $4,150,000 (Retains all properties)  │
└────────────────────────────────────────────────────────────────────────┘
What Happened to Person A
For Couple A, high fixed carrying costs combined with market declines created immediate cash drag.
Following the 4% rule, they increased their withdrawals for 9.1% inflation:
- Year 1 (2021): $200,000
- Year 2 (2022): $218,200
- Year 3 (2023): $231,000
Meanwhile, their $5,000,000 portfolio dropped to $3,450,000 by late 2022.
Withdrawing $231,000 from $3.45 million meant their effective withdrawal rate rose from 4.0% to 6.70%.
At the same time, their fixed expenses escalated:
- Tahoe insurance costs increased significantly.
- Bellevue property taxes went up.
- Fixed carrying costs grew from $95,000 to $112,000 a year.
To stop the high cash burn, Couple A decided to eliminate carrying costs by selling their Lake Tahoe home in early 2023. They accepted an offer roughly 20% below peak valuation and paid real estate commissions to exit the property.
How Person B Handled 2022
Couple B experienced the same market downturn, but their discretionary buffer absorbed the difference.
When markets dropped:
- They paused angel investing and major charitable galas ($30,000 saved).
- They skipped luxury European rentals and vacationed locally at their Tahoe home ($35,000 saved).
- Their total 2022 spending came in at $142,000.
Because $142,000 covered their property taxes and insurance with ease, daily life remained uninterrupted.
Most importantly, Couple B never had to sell equities at the bottom, and they kept both of their homes.
Their portfolio troughed at $4,150,000, which was $700,000 higher than Couple A.
The 2023 to 2024 Recovery and Divergence
Starting in early 2023, inflation cooled, rate hikes stopped, and the stock market began a sustained rally, with the S&P 500 crossing 5,800.
┌────────────────────────────────────────────────────────────────────────┐
│             The Recovery and Divergence: 2021 through 2024             │
│                                                                        │
│  $6.5M ┬                                            Person B: $6.15M   │
│        │                                           ┌───────────────────│
│  $5.0M ┼───────────┐                              ┌┘                   │
│        │            \                            /                     │
│  $3.5M ┼             \__________                /   Person A: $3.85M   │
│        │                        \______________┼───(Sold Tahoe Home)───│
│    $0  ┴───────────────────────────────────────────────────────────────│
│       2021         2022         2023         2024                      │
└────────────────────────────────────────────────────────────────────────┘
Person A: Selling at the Bottom
Couple A held cash from their Tahoe sale, but the financial outcome was poor:
- They incurred tax and transaction friction on the property sale.
- Nervous about market conditions in early 2023, they held the cash in money markets earning around 4%, missing the 50%+ equity rebound in 2023 and 2024.
- By late 2024, their liquid balance hovered around $3,850,000, over $1.1 million below their starting retirement wealth.
Person B: Capturing the Full Bull Market
Because Couple B kept their equity shares throughout 2022, they participated fully in the 2023-2024 rally.
By late 2024, their portfolio grew to $6,150,000.
Recalculating their dynamic withdrawal authorized spending of over $210,000 a year ($17,500/month).
They kept their Bellevue home, preserved their Lake Tahoe retreat, resumed their international travel, and maintained complete financial flexibility.
The 3-Year Scorecard: What Happened to Both Portfolios
Three years after retiring at the November 2021 market peak, here is where both families stood:
| Metric (Late 2024) | Person A (Fixed 4% Rule) | Person B (Dynamic Shiller CAPE) |
|---|---|---|
| Starting Balance (Nov 2021) | $5,000,000 | $5,000,000 |
| 2022 Drawdown Balance | $3,450,000 (-31% loss) | $4,150,000 (Preserved capital) |
| Current Portfolio Value (2024) | $3,850,000 (Impaired) | $6,150,000 (+23% net gain) |
| Vacation Home Status | Sold at a discount | 100% Retained & Enjoyed |
| Max Withdrawal Rate Reached | 6.70% (danger zone) | 3.42% (safe guardrail) |
| Household Reality | Regret over selling assets at low | Stable lifestyle, zero real estate loss |
The FatFIRE Blueprint: Rules for $4M to $10M Portfolios
If you have built a portfolio between $4,000,000 and $10,000,000, use these safeguards to protect your capital:
1. Monitor Your Fixed Carrying Cost Ratio
Calculate your mandatory overhead like property taxes, insurance, maintenance, and accounting. Your fixed carrying costs should stay under 60% of your baseline withdrawal floor. If you own multiple properties with $100,000 in fixed overhead, your portfolio must be able to support at least $160,000 at a defensive 3.0% withdrawal rate.
2. Guardrail Initial Draws at High CAPE
When stock market valuations exceed CAPE 32, avoid starting retirement at a flat 4.0%. Cap your initial withdrawal at 3.0% to 3.3%:
SWR = 1.75% + 0.50 × (1 / CAPE)
3. Luxury Real Estate is Not Liquid Capital
A secondary property with no mortgage does not pay utility bills or property taxes, it consumes cash. Never count illiquid luxury real estate as part of your liquid safe withdrawal base.
4. Stress-Test Your Balance Sheet
Test your portfolio, real estate overhead, and spending flexibility against all 154 historical market cohorts:
👉 Simulate Your Portfolio in TheGosset FI Portal
If you haven’t set up your private Google Sheet dashboard yet, follow our setup tutorial:
👉 Setting Up TheGosset FI Portal: Step-by-Step Guide
The Complete Shiller CAPE Avatar Cluster
Explore the complete collection of real-world A/B case studies across every wealth bracket:
- 📚 Foundational Guide: Dynamic Safe Withdrawal Rates: Why Shiller CAPE Beats the 4% Rule
- 🚲 LeanFIRE ($600k): Retiring on $600k: Elena’s LeanFIRE Stress-Test in 1970s Stagflation
- 👨👩👧👦 Core FIRE ($1.25M): Retiring on $1.25M: Marcus & Priya's 4% Rule vs. Shiller CAPE A/B Test
- 🎿 ChubbyFIRE ($2.5M): Retiring on $2.5M: David’s ChubbyFIRE Stress-Test in the 2008 Crash
- 🏰 FatFIRE ($5.0M): Retiring on $5M: The Sterlings’ FatFIRE Blueprint in the 2022 Crash