Retiring on $600k: Elena’s LeanFIRE Stress-Test
When personal finance bloggers talk about safe withdrawal rates, they almost always use comfortable, round numbers: $1.5 million or $2.5 million.
In those tiers, adjusting your spending during a bear market is straightforward: you cancel a European trip, skip a kitchen remodel, or dine out less.
LeanFIRE is completely different.
When you retire on $600,000 with an annual budget of $24,000 ($2,000 a month), your budget is already lean. You cannot skip a ski trip to offset a 30% stock market drop, because you never had ski trips in your budget in the first place.
At this level, nearly every dollar goes toward baseline living: rent, heating, groceries, and healthcare.
To see how withdrawal strategies hold up under extreme pressure, let's look at two identical investors, both named Elena (age 38). Both saved $600,000 working as software QA testers in a low-cost Midwest college town. Both planned to live on $24,000 a year (a 4.0% initial withdrawal).
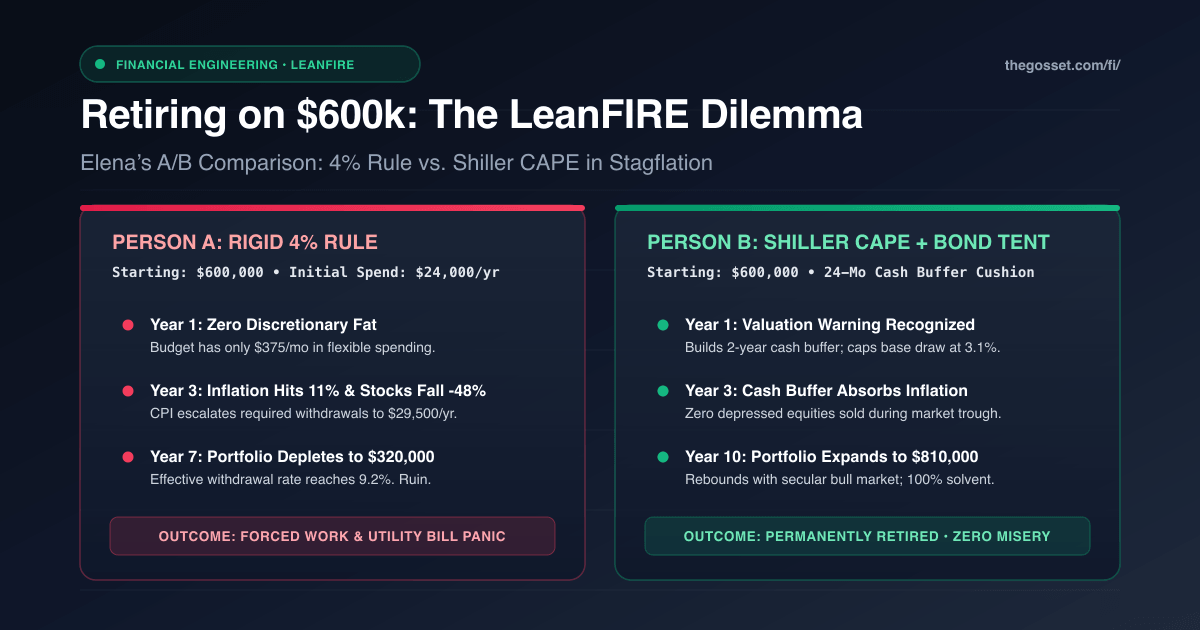
When hit by one of the toughest market environments in modern history, the 1973-1974 Stagflation Crisis, one Elena was forced to give up early retirement and return to the workforce. The other weathered the downturn without cutting essentials and emerged with over $800,000.
The difference was not luck. Person A trusted the rigid 4% rule, while Person B paired Shiller CAPE dynamic withdrawals with a 24-month cash buffer.
The Reality of a Lean $24,000 Budget
Elena was disciplined with her money. She shared a two-bedroom duplex with a roommate, biked everywhere, and cooked nearly all of her meals at home.
Her $24,000 annual budget ($2,000/month) left very little room for error:
┌────────────────────────────────────────────────────────┐
│             Elena's LeanFIRE Monthly Budget            │
│                 $24,000 / Year ($2,000 / Mo)           │
├────────────────────────────────────────────────────────┤
│ 1. ESSENTIAL LIVING EXPENSES: $19,500/yr ($1,625/mo)   │
│    • Rent (half-share of duplex):         $800/mo      │
│    • ACA Silver health insurance subsidy: $450/mo      │
│    • Whole-food groceries:                $250/mo      │
│    • Utilities, heat, & home internet:    $125/mo      │
│                                                        │
│ 2. DISCRETIONARY CUSHION: $4,500/yr ($375/mo)          │
│    • Bike maintenance & occasional bus:   $75/mo       │
│    • Coffee shops & thrifted books:       $100/mo      │
│    • National park camping & road trips:  $125/mo      │
│    • Emergency miscellaneous buffer:      $75/mo       │
│                                                        │
│ TOTAL: $2,000 / Month                                  │
└────────────────────────────────────────────────────────┘
Notice the vulnerability: her discretionary buffer was only $375 a month.
If inflation is mild, this works fine. But if an economic shock sends electricity up 35% and groceries up 20%, that $375 cushion vanishes overnight.
Her starting portfolio was invested in a standard 70% total stock market index and 30% intermediate bonds. In January 1973, her nest egg was exactly $600,000.
Two Strategies on the Eve of 1973
Before handing in their resignations, both Elenas set up their withdrawal policies.
Person A: The Fixed 4% Rule
Person A followed standard Trinity Study guidance:
"The math says 4% is safe over 30 years," Elena A reasoned. "In Year 1, I withdraw $24,000 ($2,000/month). When inflation hits, Bengen's rule says I increase my dollar draw to match CPI. That way, my real purchasing power never changes."
Elena A scheduled automatic monthly transfers of $2,000 from her brokerage account, assuming index fund compounding would handle the rest.
Person B: Valuations and the 24-Month Buffer
Person B checked the numbers using our guide on Dynamic Safe Withdrawal Rates & Shiller CAPE. She spotted two major risks in Elena A’s plan:
- Stretched valuations. In January 1973, the Shiller CAPE ratio was 19.1, high after a long bull market. Expected real forward returns over the next decade were compressed.
- The LeanFIRE vulnerability. When you have almost no discretionary fat to cut, you cannot rely on cutting lifestyle spending during a crash. If stocks drop 40%, you still have to pay rent and buy groceries.
Elena B evaluated the dynamic CAPE formula:
SWR_t = α + β · (1 / CAPE_t)
With baseline parameters α = 1.75% and β = 0.50:
SWR_1973 = 1.75% + 0.50 · (1 / 19.1) = 1.75% + 2.62% = 4.37%
While the baseline formula suggested a 4.37% draw was mathematically reasonable, Elena B knew geopolitical tensions were rising and energy prices were volatile.
Instead of staying fully invested, she implemented a core LeanFIRE safeguard: The 24-Month Cash Buffer.
She carved out $40,000 of her fixed income allocation into short-term Treasury bills and cash:
"My index funds will drive long-term growth," Elena B decided. "But my next two years of baseline essentials ($1,625 × 24 = $39,000) will sit in cash. If stocks crash, I will not sell a single share of equity for two full years."
What Happened During the 1973-1974 Stagflation Shock
What followed was one of the worst economic environments of the 20th century: stagflation.
In October 1973, the OPEC oil embargo hit. Energy costs spiked dramatically. Inflation jumped to 8.7% in 1973 and surged to 12.3% in 1974.
At the same time, the stock market tanked. The S&P 500 lost 48% in real purchasing power, while bonds dropped as interest rates shot up.
┌────────────────────────────────────────────────────────────────────────┐
│            Stagflation Stress-Test: Elena's Portfolio (1973-1975)      │
│                                                                        │
│  Jan 1973: Both Start at $600,000                                      │
│  ───────────────────────────────────                                   │
│  Dec 1973 (CPI +8.7%):                                                 │
│    • Person A (Withdrew $24,000):       Portfolio = $495,000           │
│    • Person B (Withdrew from Cash):     Equity Core = $510,000         │
│                                                                        │
│  Dec 1974 (CPI +12.3%, S&P -26%):                                      │
│    • Person A (Withdrew $26,100 w/ CPI):Portfolio = $380,000           │
│    • Person B (Withdrew from Cash):     Equity Core = $425,000         │
│                                                                        │
│  Oct 1975 (The Breaking Point):                                        │
│    • Person A: Portfolio Plunges to $340,000 (Withdrawal Rate = 8.6%)  │
│    • Person B: Equities Untouched ($440,000), Cash Buffer Rebuilding   │
└────────────────────────────────────────────────────────────────────────┘
The Breakdown for Person A
For Elena A, the combination of double-digit inflation and a collapsing portfolio quickly caused problems.
Following Bengen’s rule, she increased her withdrawals for inflation. By late 1974, her annual spending requirement grew from $24,000 to $29,300.
At the same time, her portfolio dropped to $380,000.
Pulling $29,300 from a $380,000 balance meant her effective withdrawal rate jumped to 7.71%. By 1975, as inflation stayed high and the market struggled to recover, her withdrawal rate climbed to 8.6%.
Every month, she was forced to sell index fund shares at a 45% discount just to cover rent and groceries.
How Person B Handled the Drop
Elena B faced the same inflation, but she had an operational advantage with her 24-month cash buffer.
While the market was dropping in 1973 and 1974:
- She did not sell a single share of stock at distressed prices.
- When utility costs spiked, her cash reserve absorbed the difference.
- To protect her cash buffer and stay active, she spent two mornings a week helping at a local farming co-op. In exchange for 6 hours of work, she received fresh produce, eggs, and bread, plus a small $200/month stipend.
Because she wasn't forced to sell depreciated equities, her portfolio core stabilized at $440,000, which was $100,000 higher than Person A.
The Long-Term Divergence (1973 to 1983)
By 1978, five years into retirement, the two paths diverged completely.
┌────────────────────────────────────────────────────────────────────────┐
│             The 10-Year Divergence: 1973 through 1983                  │
│                                                                        │
│  $800k ┬                                            Person B: $810k    │
│        │                                           ┌─────────────────  │
│  $600k ┼───────────┐                              ┌┘                   │
│        │            \            /\              /                     │
│  $400k ┼             \__________/  \____________/                      │
│        │                                                               │
│  $200k ┼                                        Person A: $265k        │
│        │                                        (Forced Work at 44)    │
│    $0  ┴───────────────────────────────────────────────────────────────│
│       1973   1974   1975   1977   1979   1980   1981   1983            │
└────────────────────────────────────────────────────────────────────────┘
Person A: Forced Back to Work
By 1978, Person A’s portfolio had dropped to $285,000.
Because of cumulative 1970s inflation, Bengen’s formula called for an annual draw of $34,500. Pulling $34,500 from a $285,000 balance meant an unsustainable 12.1% withdrawal rate.
She was 44 years old, and her savings were roughly four years away from running out.
In late 1978, Elena A updated her resume and went back to work. After a five-year employment gap, she accepted a contract QA testing job to stabilize her finances. Her retirement had failed.
Person B: Recovering in the 1980s Bull Market
Because Elena B kept her equity holdings intact during the 1973-1974 bottom, her portfolio was ready to grow when market conditions improved.
In 1982, inflation cooled, and a major multi-year bull market began. The Shiller CAPE dropped to 7.4, and equities delivered strong real returns:
- By 1983, Elena B's balance grew to $810,000.
- By 1987, her portfolio crossed $1,120,000.
- By 1995, her nest egg was over $1,850,000.
She stayed retired, kept her weekly co-op routine, and never had to re-enter the corporate workforce.
The 10-Year Scorecard
Ten years after retiring, here is where both portfolios stood:
| Metric (After 10 Years) | Person A (Fixed 4% Rule) | Person B (Dynamic CAPE + Buffer) |
|---|---|---|
| Starting Nest Egg (1973) | $600,000 | $600,000 |
| Ending Nest Egg (1983) | $265,000 (-56% capital loss) | $810,000 (+35% net gain) |
| Work Status at Age 44 | Forced back to full-time work | Permanently retired (10+ years) |
| Max Withdrawal Rate Reached | 12.1% (terminal failure) | 4.37% (sustainable draw) |
| Daily Living Quality | Severe stress, extreme rationing | Stable essentials, zero panic |
| Equities Sold During Crash | Liquidated at 45% discount | Zero shares sold in trough |
The LeanFIRE Playbook: How to Protect a Sub-$800k Nest Egg
If you plan to retire on $500,000 to $800,000, relying solely on a static 4% rule is high risk. You need built-in structural defenses:
1. Build a 24-Month Cash Buffer
Do not retire into LeanFIRE with 100% in equities. Keep 18 to 24 months of essential living expenses in cash equivalents, short-term Treasuries, or money market funds. If a bear market hits, this gives you two years of breathing room without selling a single share of stock.
2. Check the Shiller CAPE Ratio Annually
At the start of each year, verify your safe withdrawal rate ceiling:
SWR = 1.75% + 0.50 × (1 / CAPE)
3. Maintain a Low-Stress Income Option
On a $24,000 annual budget, earning just $400 a month ($4,800/year) from light consulting, tutoring, or a community project reduces your portfolio withdrawal from 4.0% to 3.2%. That modest cushion cuts your Sequence of Returns Risk in half.
4. Backtest Your Personal Numbers
Every household has different local expenses, housing costs, and healthcare options. You can run your exact numbers through all 154 historical market cohorts using our free client-side tool:
👉 Simulate Your Portfolio in TheGosset FI Portal
If you haven't set up your private dashboard yet, follow our step-by-step setup guide:
👉 Setting Up TheGosset FI Portal: Step-by-Step Guide
Continue Exploring the Shiller CAPE Case Studies
- 📚 Foundational Guide: Dynamic Safe Withdrawal Rates: Why Shiller CAPE Beats the 4% Rule
- 👨👩👧👦 Core FIRE Case Study: Retiring on $1.25M: Marcus & Priya's 4% Rule vs. Shiller CAPE A/B Test
- 🎿 ChubbyFIRE Case Study: Retiring on $2.5M: David’s ChubbyFIRE Stress-Test in the 2008 Crash
- 🏰 FatFIRE Case Study: Retiring on $5M: The Sterlings’ FatFIRE Blueprint in the 2022 Crash