Retiring on $2.5M: David’s ChubbyFIRE Stress-Test
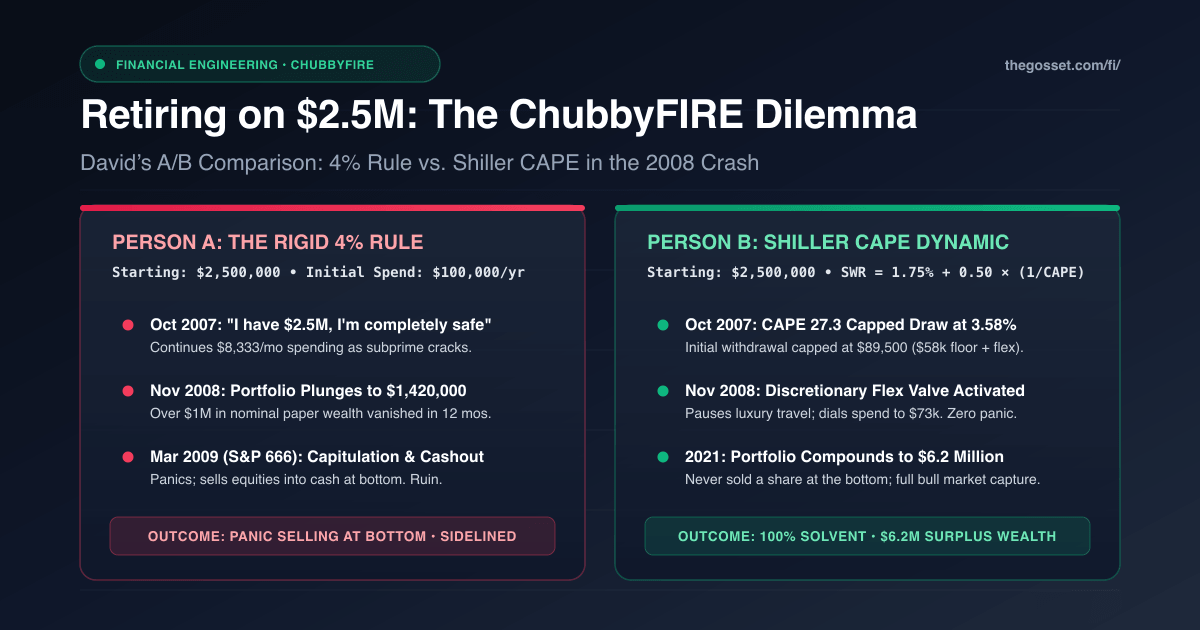
When people hear about retirement anxiety with a $2,500,000 portfolio, their first reaction is skepticism: "You have two and a half million dollars. How could you possibly fail?"
This tier is what the FIRE community calls ChubbyFIRE, the middle ground between minimalist frugality (LeanFIRE) and ultra-wealth (FatFIRE). A $2.5M nest egg paired with a standard 4% withdrawal rate delivers a comfortable $100,000 a year ($8,333 a month).
Yet when backtesting historical market cycles, ChubbyFIRE retirees don't fail because they can't afford groceries. They fail because of nominal paper loss panic.
Losing 40% of a $600k portfolio hurts. But losing 55% of a $2.5M portfolio means watching $1,375,000 vanish from your account balance in 16 months.
For professionals who spent decades saving, seeing seven figures disappear often triggers the single most destructive move in investing: selling equities to cash at the bottom of a crash.
Here is the story of two identical investors, both named David (age 47). Both retired on October 1, 2007, with an identical $2,500,000 in index funds and an identical $100,000 annual spending target.
One David panic-sold at the bottom of the 2008 crash and derailed his retirement. The other used the Shiller CAPE dynamic formula, stayed invested, and compounded his portfolio past $6 million.
The $2.5M Starting Line and Budget Breakdown
David worked in software engineering for 22 years, ending his career as an infrastructure director in Denver, Colorado.
He owned a home with a small remaining mortgage and enjoyed regular travel, ski trips, golf, and dining out.
His $100,000 annual budget ($8,333/month) looked like this:
┌────────────────────────────────────────────────────────┐
│             David's ChubbyFIRE Annual Budget           │
│                $100,000 / Year ($8,333 / Mo)           │
├────────────────────────────────────────────────────────┤
│ 1. FIXED OVERHEAD (NON-DISCRETIONARY): $58,000 / Year  │
│    • Mortgage & local property taxes:     $2,500/mo    │
│    • Private ACA family health insurance: $1,100/mo    │
│    • Groceries & household maintenance:   $750/mo      │
│    • Utilities, home internet, cell:      $300/mo      │
│    • Vehicle insurance & maintenance:     $183/mo      │
│                                                        │
│ 2. LIFESTYLE FLEX (DISCRETIONARY): $42,000 / Year      │
│    • Annual 2-week European ski vacation: $18,000/yr   │
│    • Private country club & fitness:      $8,000/yr    │
│    • Weekend fine dining & wine:          $9,000/yr    │
│    • Tech gear, concerts, & hobbies:      $7,000/yr    │
│                                                        │
│ TOTAL: $8,333 / Month ($100,000 / Year)                │
└────────────────────────────────────────────────────────┘
Notice the key structural advantage of ChubbyFIRE: discretionary flexibility.
Over 42% of his annual budget ($42,000) was luxury spending. Unlike Elena in our LeanFIRE case study, David could cut $25,000 from his annual expenses overnight without compromising his living essentials or risking his home.
His portfolio was invested in an aggressive growth split: 80% total stock market index / 20% intermediate government bonds.
On October 1, 2007, his starting balance was exactly $2,500,000.
Two Strategies on the Eve of October 2007
In October 2007, the S&P 500 reached an all-time high of 1,565. The economy appeared strong.
What wasn't discussed in the media was that the Shiller CAPE ratio stood at 27.3, well above its historical median of 16.5.
Person A: The Fixed 4% Rule
David A relied on the traditional 4% rule:
"I have two and a half million dollars," David A told friends. "Even with a pullback, 4% gives me $100,000 a year. The Trinity Study proved that 4% works through historical downturns. I don't need to overthink it."
David A automated a monthly transfer of $8,333 from his brokerage account to checking and booked first-class tickets for a European ski trip.
Person B: Valuation Awareness
David B reviewed the principles in our guide on Dynamic Safe Withdrawal Rates & Valuation Risk. He knew that retiring at a CAPE of 27.3 meant equity earnings yields were low (3.66%).
He calculated his initial withdrawal ceiling using the dynamic CAPE formula:
SWR_t = α + β · (1 / CAPE_t)
With baseline parameters α = 1.75% and β = 0.50:
SWR_2007 = 1.75% + 0.50 · (1 / 27.3) = 1.75% + 1.83% = 3.58%
The formula provided a clear guideline: At CAPE 27.3, the safe initial withdrawal rate was 3.58%, not 4.00%.
On a $2.5M portfolio, 3.58% equaled $89,500 per year ($7,458/month).
David B checked his expenses. His fixed overhead was only $58,000. An $89,500 cap still gave him $31,500 in discretionary cushion:
"I can retire right now," David B concluded. "But I won't pull $100,000 in Year 1. I’ll cap spending at $89,500, ski locally in Colorado instead of Europe, and keep that guardrail in place until market valuations normalize."
The 2008 Financial Crisis Stress-Test
Within months of retiring, the subprime mortgage crisis unfolded. Bear Stearns fell in March 2008. Lehman Brothers collapsed in September 2008. Credit markets locked up.
Between October 2007 and March 2009, the S&P 500 plunged 56.8%.
┌────────────────────────────────────────────────────────────────────────┐
│            The 2008 GFC Stress-Test: David's Portfolio (2007-2009)     │
│                                                                        │
│  Oct 2007: Both Start at $2,500,000                                    │
│  ───────────────────────────────────                                   │
│  June 2008:                                                            │
│    • Person A (Spent $66,666):          Portfolio = $2,120,000         │
│    • Person B (Spent $59,600):          Portfolio = $2,160,000         │
│                                                                        │
│  Nov 2008 (Post-Lehman Panic):                                         │
│    • Person A (Spent $100,000 total):   Portfolio = $1,420,000         │
│    • Person B (Flexed Spend to $73k):   Portfolio = $1,610,000         │
│                                                                        │
│  March 9, 2009 (The Absolute Bottom - S&P 666):                        │
│    • Person A: Collapses to $1,150,000 -> PANIC SELLS 100% TO CASH     │
│    • Person B: Preserves $1,620,000    -> HOLDS EQUITIES, REBOUNDS     │
└────────────────────────────────────────────────────────────────────────┘
What Happened to Person A
For David A, paying bills wasn't the problem. The issue was watching his net worth drop by more than a million dollars:
- October 2007: $2,500,000
- October 2008: $1,650,000 (-$850,000)
- March 2009: $1,150,000 (-$1,350,000)
Following Bengen's rule, he had adjusted his withdrawals for inflation to $104,000. Pulling $104,000 from a $1.15M portfolio meant an effective withdrawal rate of 9.04%.
On March 9, 2009, the day the S&P 500 hit its bottom at 666, David A gave in to fear. Worried about losing the rest of his savings, he moved his entire portfolio into a cash money market fund earning almost zero yield.
By selling at the trough, he turned paper drawdowns into permanent capital loss.
How Person B Managed the Crisis
David B saw the same market drop, but he had a clear system to follow.
When Lehman collapsed, David B activated his Discretionary Shock Absorber:
- He skipped the European ski trip and used a local season pass in Colorado ($18,000 saved).
- He put his country club membership on hold for 12 months ($8,000 saved).
- He trimmed his annual spending down to $73,000.
Because his fixed living costs were only $58,000, reducing spend to $73,000 was simple. He still had a $15,000 buffer and lived comfortably.
Most importantly, David B did not sell a single share of stock.
Because he kept his shares intact and reduced his cash drain, his portfolio bottomed at $1,620,000, nearly $500,000 higher than Person A.
The 2009 to 2021 Recovery and Compounding Split
What followed was one of the largest market expansions in history.
┌────────────────────────────────────────────────────────────────────────┐
│             The 14-Year Divergence: 2007 through 2021                  │
│                                                                        │
│  $6.0M ┬                                            Person B: $6.2M    │
│        │                                           ┌─────────────────  │
│  $4.0M ┼                                          ┌┘                   │
│        │                                         ┌┘                    │
│  $2.0M ┼───────────┐                            ┌┘                     │
│        │            \            /\            ┌┘                      │
│  $1.0M ┼             \__________/  \__________/                        │
│        │                                        Person A: $610k        │
│    $0  ┴────────────────────────────────────────(Sitting in Cash)──────│
│       2007   2008   2009   2011   2013   2015   2018   2021            │
└────────────────────────────────────────────────────────────────────────┘
Person A: Stuck on the Sidelines
After selling to cash in March 2009, David A planned to get back into the market "once things stabilized."
The market rebounded 60% in 2010. David A hesitated, waiting for a drop. Stocks rose again in 2011, 2012, and 2013. The longer he stayed in cash, the harder it was to re-enter.
By 2015, after six years of cash drag and living expenses, his portfolio had dwindled to $610,000.
At age 55, David A returned to the workforce as an IT contractor to cover his ongoing living expenses.
Person B: Long-Term Growth
Because David B stayed invested, his equity holdings captured the full recovery.
In March 2009, the Shiller CAPE fell to 13.3, pushing the earnings yield up to 7.52%.
In January 2010, David B ran his annual recalculation:
SWR_2010 = 1.75% + 0.50 · (1 / 13.3) = 1.75% + 3.76% = 5.51%
The formula confirmed that forward expected returns were strong. With his capital preserved, he restored his travel budget and expanded his discretionary spending.
Over the following bull market:
- By 2013, David B's balance reached $2,800,000.
- By 2017, his portfolio crossed $4,200,000.
- By 2021, his nest egg grew past $6,200,000, while spending over $140,000 a year.
The 14-Year Scorecard: What Happened to Both Portfolios
Fourteen years after retiring in October 2007, here is where both investors stood:
| Metric (After 14 Years) | Person A (Fixed 4% Panic) | Person B (Dynamic Shiller CAPE) |
|---|---|---|
| Starting Balance (2007) | $2,500,000 | $2,500,000 |
| Trough Balance (2009) | $1,150,000 (Sold to cash) | $1,620,000 (Stayed invested) |
| 2021 Balance | $610,000 (Eroded by cash drag) | $6,200,000 (+148% surplus wealth) |
| Work Status at Age 55 | Forced back into consulting | Permanently retired (14+ years) |
| Current Annual Spend | Reduced to $45,000/yr | Expanded to >$140,000/yr |
| Primary Failure Factor | Panic-selling at market low | Rule-based spending adjustment |
The ChubbyFIRE Playbook ($2M to $4M Portfolios)
If you have built a portfolio between $2,000,000 and $4,000,000, you have substantial flexibility. Use these guidelines to protect your wealth:
1. Keep Fixed Overhead Under 65% of Total Spend
The greatest strength of ChubbyFIRE is discretionary room. If your fixed costs are below 65% of your target spend, you can easily cut $20,000 to $30,000 in travel or luxury expenses during a downturn without disrupting your day-to-day lifestyle.
2. Guardrail Initial Draws at High CAPE
When stock market valuations exceed CAPE 26, never initiate retirement at a blind 4.0%. Cap your initial withdrawal at 3.2% to 3.6%:
SWR = 1.75% + 0.50 × (1 / CAPE)
3. Establish a Clear Policy Against Panic-Selling
Write down your investment rules before you retire: never move equity allocations to cash during a market drawdown. By letting your dynamic formula scale spending back temporarily, you let the portfolio recover naturally.
4. Stress-Test Your Portfolio
Don't guess how your allocation would hold up during 2000 or 2008. Run your exact numbers through our 154-year dataset:
👉 Simulate Your Portfolio in TheGosset FI Portal
If you haven’t connected your private Google Sheet yet, follow our step-by-step setup guide:
👉 Setting Up TheGosset FI Portal: Step-by-Step Guide
Continue Exploring the Shiller CAPE Case Studies
- 📚 Foundational Guide: Dynamic Safe Withdrawal Rates: Why Shiller CAPE Beats the 4% Rule
- 🚲 LeanFIRE Case Study: Retiring on $600k: Elena’s LeanFIRE Stress-Test in 1970s Stagflation
- 👨👩👧👦 Core FIRE Case Study: Retiring on $1.25M: Marcus & Priya's 4% Rule vs. Shiller CAPE A/B Test
- 🏰 FatFIRE Case Study: Retiring on $5M: The Sterlings’ FatFIRE Blueprint in the 2022 Crash